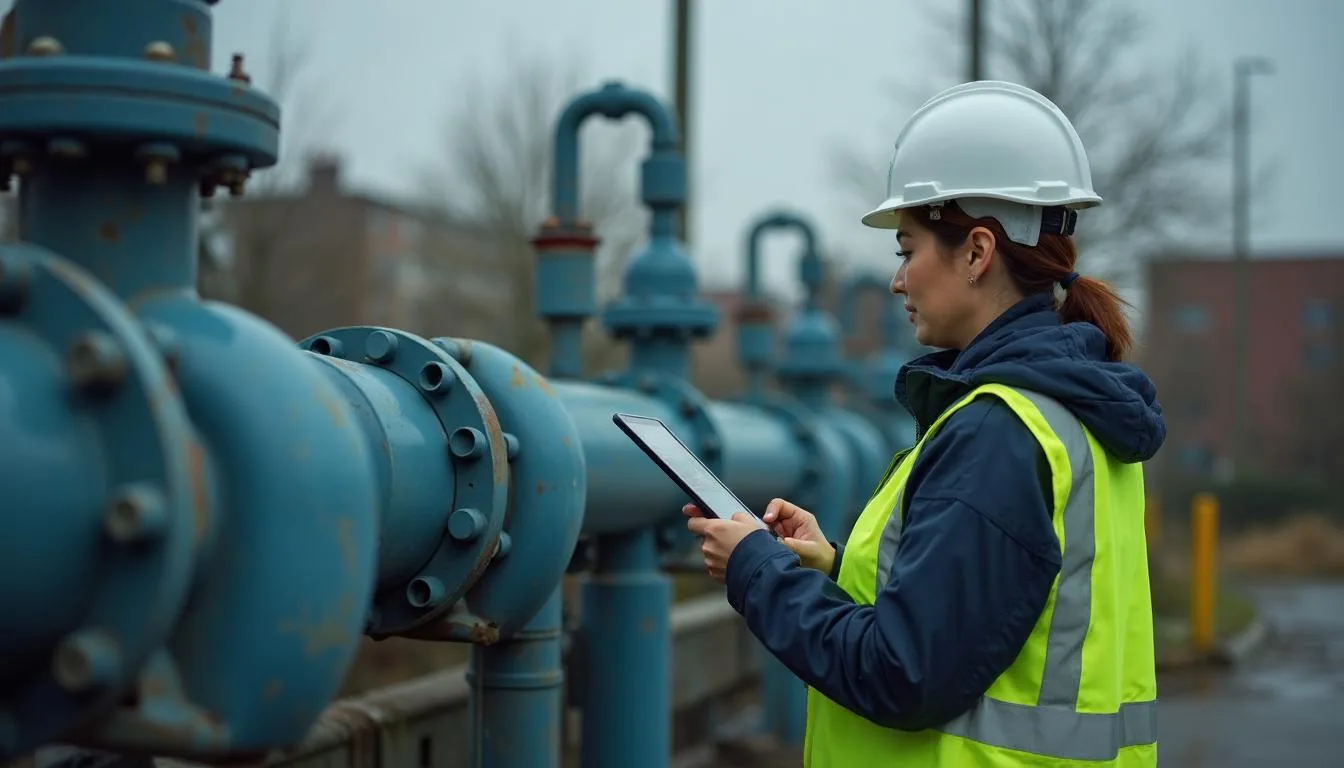
Non revenue water software that turns your annual water audit into something you can defend
Non revenue water is the gap between the water a utility puts into distribution and the water it bills for. Neurobird computes the AWWA M36 water balance from your meter, SCADA and billing data, grades every input, splits apparent losses from real losses, and produces a state ready water audit. Built for utility operations managers who currently rebuild that spreadsheet by hand every year.
Neurobird Water Loss Non Revenue in short
- Compute the AWWA M36 water balance from meter and billing data
- Separate apparent losses from real losses with a data grade on every input
- Rank leak candidates by volume lost per day so crews chase the biggest first
- 6 billion gallons Treated drinking water estimated lost every day across US systems, enough to fill more than 9,000 swimming pools. ASCE Infrastructure Report Card
- Every 2 minutes A water main breaks somewhere in the United States, which is where a large share of real losses originates. ASCE Infrastructure Report Card
- Pricing runs 250 to 1200 US dollars per month across 3 tiers. Early access is free.
What water utilities actually deal with
Why it stays broken
Water loss control sits between three departments. Production owns the input volume, billing owns the consumption, and distribution owns the pipes. No single system holds all three, so the audit becomes an annual reconciliation project rather than an operating number anyone watches.
Roughly 50,000 community water systems in the United States, and most build the balance in Excel.
Real losses are the actual physical losses of water from the distribution system and include such things as reservoir overflows, leaky valves, and water main breaks.
Neurobird Water Loss Non Revenue Audit Platform
One place to compute the water balance, grade the inputs, and show your work. It reads what you already have rather than asking you to replace AMI or SCADA.
- 1Compute the AWWA M36 water balance from meter and billing data
- 2Separate apparent losses from real losses with a data grade on every input
- 3Rank leak candidates by volume lost per day so crews chase the biggest first
- 4Produce the state submission without rebuilding the spreadsheet each year
What changes with Neurobird Water Loss Non Revenue?
The same work, read left to right: how it runs today, and how it runs once the record is in one place.
| Today | With Neurobird Water Loss Non Revenue |
|---|---|
| The annual water audit lives in a spreadsheet that one person understands, and that person is retiring | Compute the AWWA M36 water balance from meter and billing data |
| Apparent losses and real losses get lumped together, so nobody can say whether the problem is metering or pipes | Separate apparent losses from real losses with a data grade on every input |
| Validating the AWWA data grading takes weeks because the source numbers sit in four systems that do not talk | Rank leak candidates by volume lost per day so crews chase the biggest first |
Who is this for?
The same water balance, three very different jobs.
You are the whole water department
You do the audit because someone has to. You need it computed from your own readings and formatted for the state, without becoming a second job every spring.
You have districts and no visibility
You have district metered areas but the losses per district live in different files. You need one ranked list telling you which zone is leaking the most water per day.
You report for multiple systems
You consolidate audits from several systems with different data quality. You need each input graded so you can defend the combined number to a validator.
How does Neurobird Water Loss Non Revenue work?
Connect your sources
Pull system input volume from SCADA or production records and billed consumption from your billing system. Nothing is retyped.
Grade every input
Each figure carries an AWWA data grade, so the balance shows its own confidence instead of implying false precision.
Rank what to fix
Leak candidates sort by estimated volume lost per day, so crews chase the biggest number first rather than the loudest complaint.
The water balance, as your team would use it
A working preview of the audit view. Tick a district meter to log an inspection and watch the coverage change.
Tap an asset to log a scan and timestamp the inspection.
What the numbers say about water loss in the United States
Useful background if you are making the case for a water loss programme internally. Every figure below is from a named authority and links to the source.
Treated drinking water estimated lost every day across US systems, enough to fill more than 9,000 swimming pools.
ASCE Infrastructure Report CardA water main breaks somewhere in the United States, which is where a large share of real losses originates.
ASCE Infrastructure Report CardReduction in main breaks per 100 miles of pipe since 2018, evidence that targeted programmes work when losses are measured properly.
ASCE Infrastructure Report CardState water managers expecting shortages under average conditions in some part of their state, which is why regulators increasingly ask for the audit.
US EPA WaterSense, citing GAOThe industry standard method for the annual water audit, and the basis for the free AWWA audit software most utilities start with.
American Water Works AssociationWater loss non revenue software questions, answered
Key terms
- What is non revenue water?
- Non revenue water is the difference between the volume a utility puts into distribution and the volume it bills for. It covers real losses such as leaks and breaks, apparent losses such as meter under-registration and billing error, and unbilled authorised consumption such as hydrant flushing.
How do you calculate a water balance?
You start with system input volume, subtract billed authorised consumption to get non revenue water, then split that into unbilled authorised consumption, apparent losses and real losses. The AWWA M36 method assigns a data grade to each input so the result carries a confidence level rather than a false precision.
Does this replace our AMI or SCADA system?
No. It reads from them. AMI gives you consumption, SCADA gives you production, and the audit sits on top to reconcile the two and tell you where the gap is.
Can it produce our state validated audit submission?
That is the point of it. The output is formatted for state submission with each input carrying its data grade and its source, so a validator can follow your arithmetic.
Why we are building this
A growing number of states now require a validated water loss audit, and the method is well documented in AWWA M36. What is missing is software. Most utilities still assemble the balance in a spreadsheet that one person maintains and everyone else hopes keeps working.
That gap is the whole reason this exists. The requirement is real, the method is settled, and the tooling never arrived.
We would rather build it with the people who actually run the audit than guess at it. If that is you, tell us how you do it today, and tell us where we have got it wrong.
Where the requirement comes from
These are the documents that put the audit on your desk. All verified live, linked straight to the source.
- California DWR Water Audit Manual California's validated water loss reporting manual, the reference for how the audit is compiled and graded.
- Washington State DOH, leakage and water loss State guidance on distribution system leakage standards and what systems must report.
- Colorado Water Conservation Board, urban water efficiency State programme covering water loss auditing and efficiency planning for covered entities.
- Alliance for Water Efficiency, water loss policy Policy position on why validated audits, not estimates, should be the basis for loss reporting.
- Alliance for Water Efficiency, 2024 water loss update Current state of water loss regulation and which states now require validated reporting.
- USGS Water Data API Public hydrological data source we can pull from when you need external corroboration.
How much does Neurobird Water Loss Non Revenue cost?
Priced per utility, not per seat, because the audit is one number and the whole team should be looking at it. Early access pricing is held for the first year.
- One water system
- AWWA M36 balance
- Data grading on every input
- Annual audit export
- Email support
- Up to 12 district metered areas
- Leak candidate ranking
- SCADA and billing connectors
- State submission format
- Named contact
- Unlimited systems and districts
- Multi utility reporting
- Historical trend and target setting
- Validator ready evidence pack
- Onboarding included
Get free early access
If you run the water audit, or you inherit it every spring, tell us how you build it today. We are shaping the first version around real workflows, not assumptions.
Straight answer on where this is: The software is in development. Joining early access gets you the working preview, influence on what ships first, and early access pricing. It does not get you a login today, and we will not pretend otherwise.
Prefer email? Write to office@neurobird.com and a person will reply. No autoresponder.